Purpose
The VisualFlatter is a standalone application to analyze the differences between a 3D mesh
and an unfolded version of the mesh.
Unfoldings of 3D data like this are common in medical applications,
the application can be used to make the user aware of distortions introduced in the projection process.
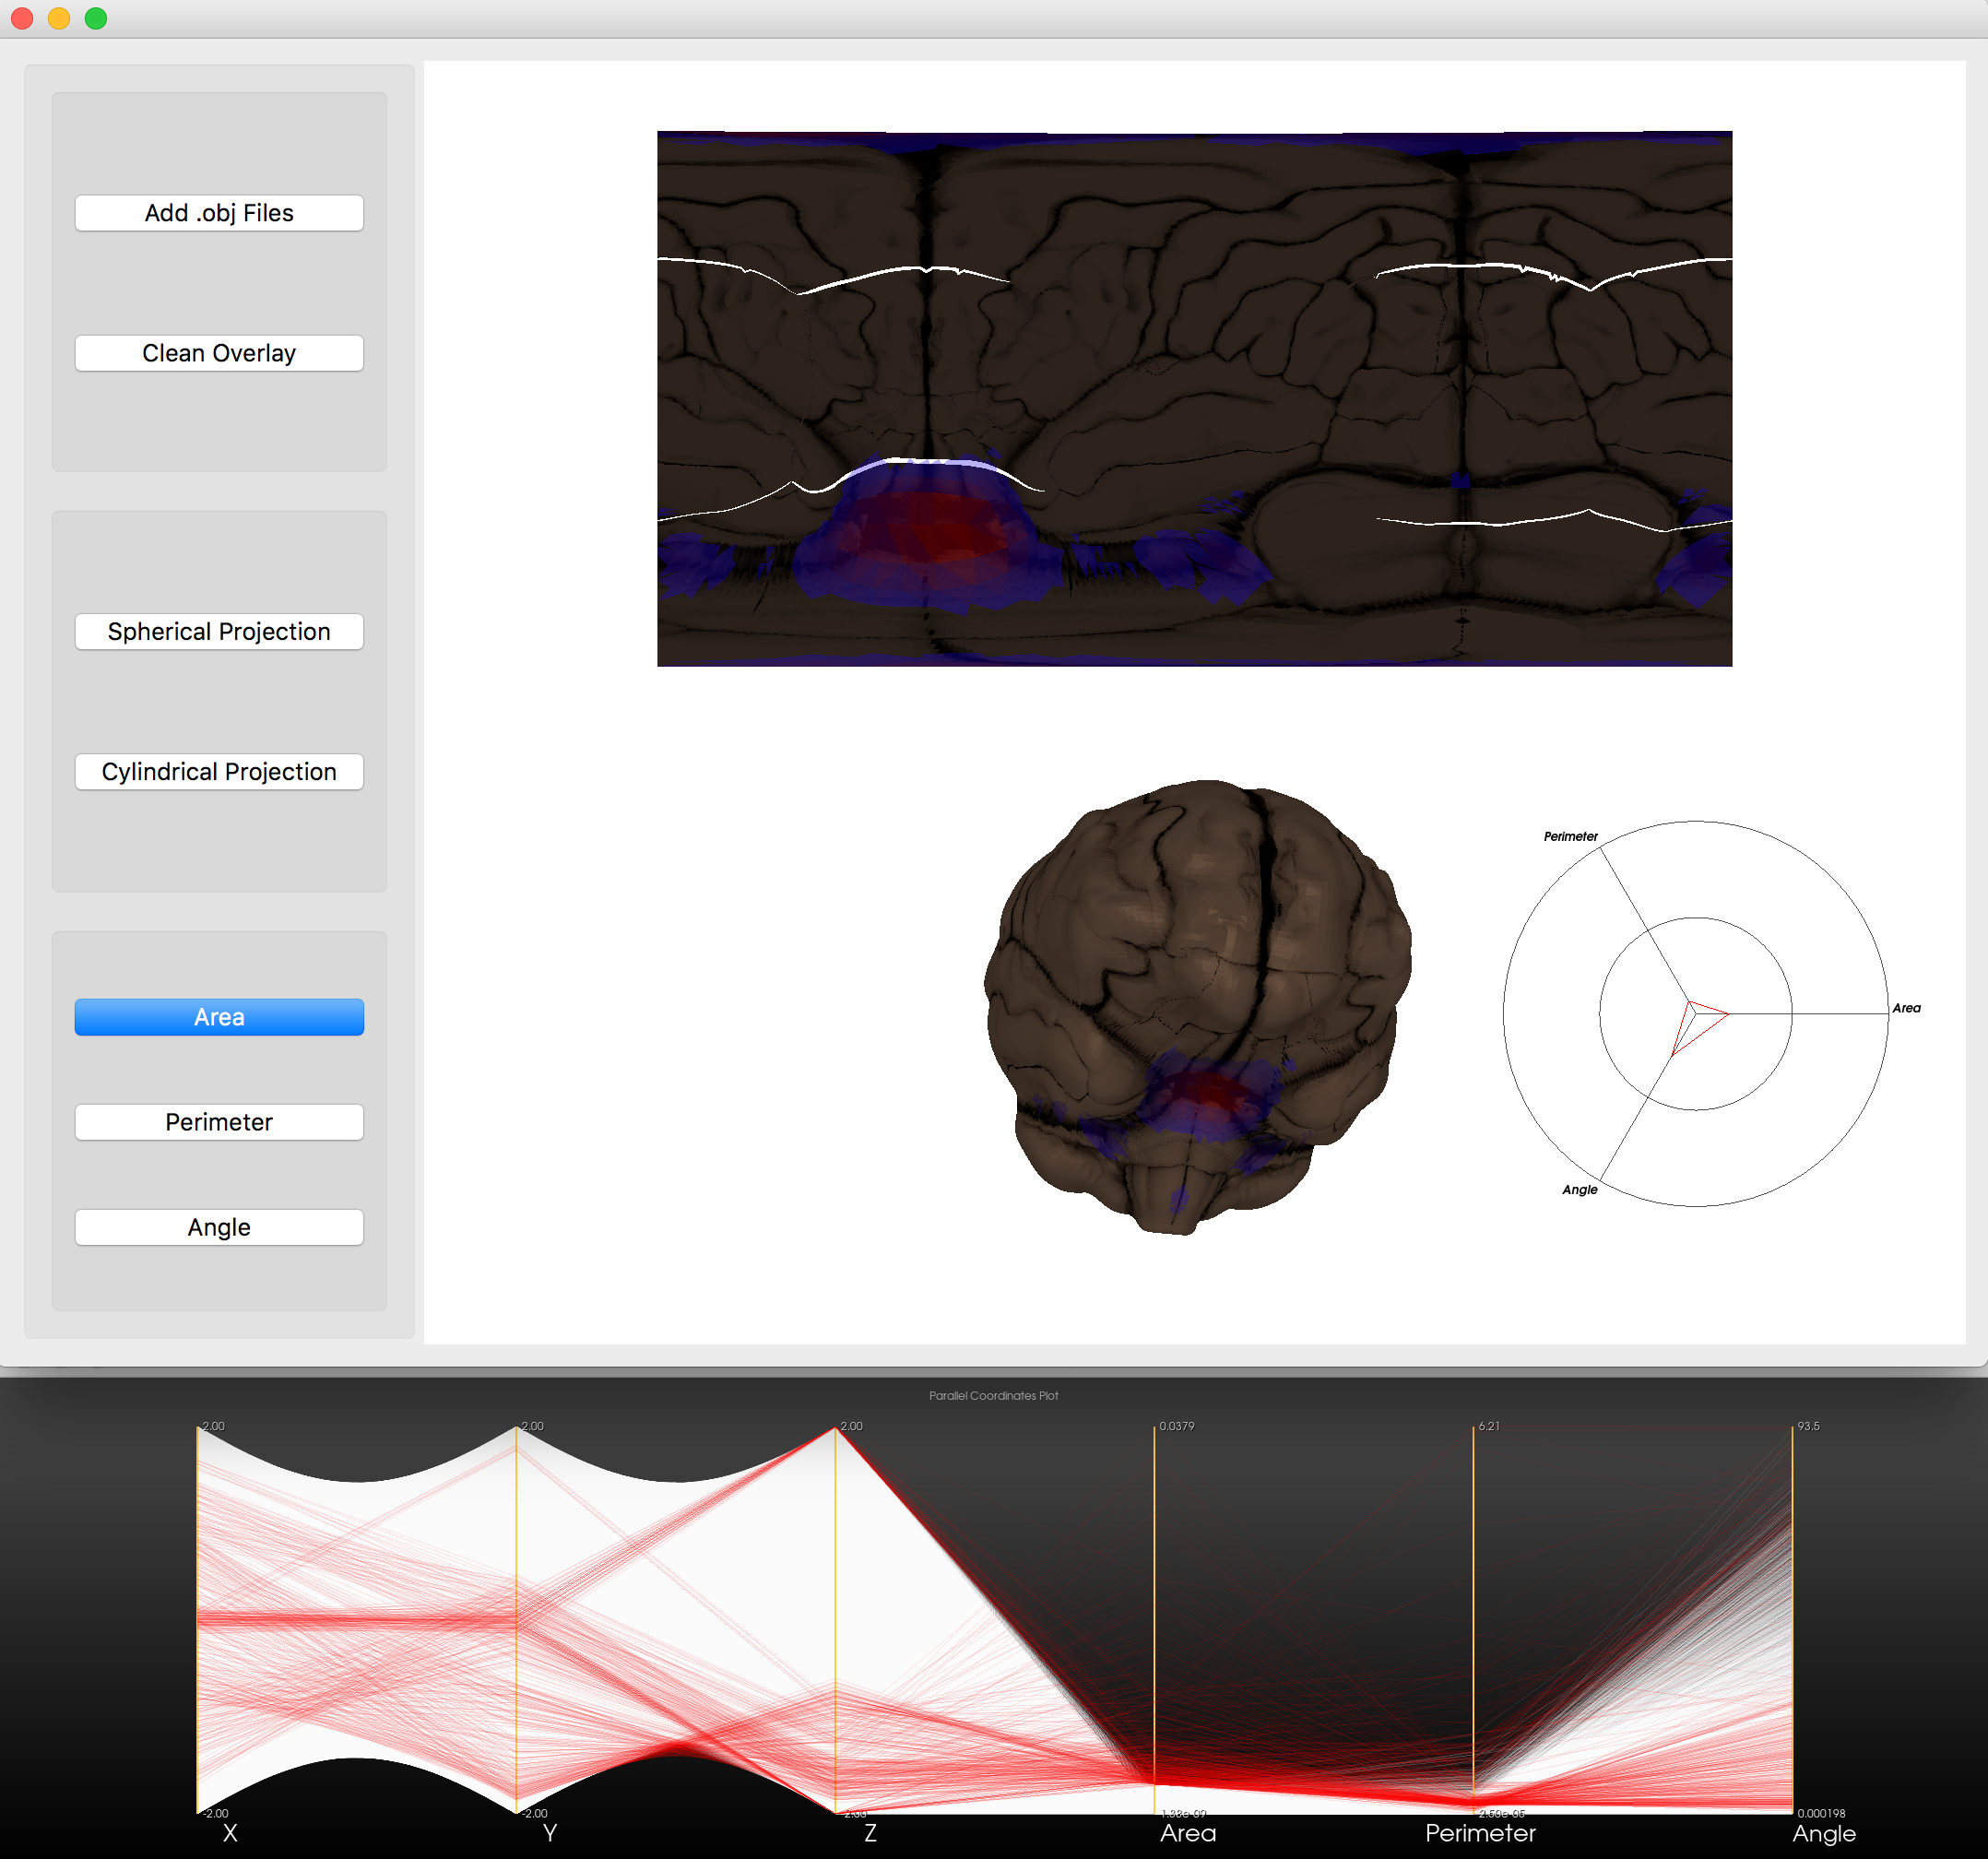
The application features two types of projection one based on spherical coordinates and one based on cylindrical coordinates.
Differences between the original mesh and the unfolded mesh can be visualized with color overlays, a parallel coordinate plot and a radar chart for the mesh attributes Area, Perimeter and Angle.
The parallel coordinate plot features brushing, to enable the selection and comparison of regions of both meshes.
Additionally, it is possible to select single triangles of the original mesh per right-click and compare them in the radar chart.
If a region is selected before the selection of a single triangle, it is possible to compare them in the radar chart.
The selection of a new region will clear all the color-overlays and radar charts and add new ones.
The implementation of the application is based on VTK and written in Python.
Code and Executable
Download the
Source Code
, the
Meshes
folder and the
Executable
.
Usage
As input for the application, the user needs to provide a .obj file with corresponding .mtl file and texture in .png format.
All input data should be in a folder in the same directory as the executables or source files called "Meshes".
The 3D data can be imported via the "Add .obj File" button.
Afterward, the attribute (Area, Perimeter or Angle) to visualize by colors needs to be selected, it is also possible to change it after the projection.
Now the mesh can be projected by either using spherical or cylindrical coordinates with the corresponding projection button.
This will open a new window, containing a parallel coordinates plot.
This plot features brushing on left-click, by drawing a line which will select and highlight the associated region to the selected triangles, on both the original and the unfolded mesh,
it additionally opens a radar chart showing the mean value of the area for all three mesh attributes.
On the original mesh, it is possible to select single triangles that will be highlighted and the associated attribute values will be plotted in the radar chart.
Warning
The application was written and tested mainly on a macOS, where it works fine.
While testing on a windows system, the drawing of the parallel coordinates plot needed a lot more computational resources and slowed down the system.
Reference Paper
Nicolas Grossmann, Thomas Köppel, M. Eduard Gröller, and Renata G. Raidou. 2018. VisualFlatter: visual analysis of distortions in the projection of biomedical structures. In Proceedings of the Eurographics Workshop on Visual Computing for Biology and Medicine (EG VCBM ’18). Eurographics Association, Goslar, DEU, 167–177. DOI:https://doi.org/10.2312/vcbm.20181242